Decrement (%) = [(total time ÷ (best time × repetitions)) × 100] − 100What the percentage represents
Repeated sprint tests ask an athlete to run several short efforts with a fixed recovery period. Coaches often want to know both how fast the athlete can sprint and how much performance changes across the set. A single “fatigue index” may appear to answer both, but the formula matters.
The percentage-decrement method compares the athlete's total time with a hypothetical total in which every repetition equals the athlete's best time. For an illustrative calculation, take six 30 m runs recorded as 5.00, 4.90, 4.95, 5.10, 5.20 and 5.30 seconds. These are example values, not study data. Their total is 30.45 seconds; the best-time reference is 4.90 × 6, or 29.40 seconds, giving a decrement of about 3.6%. Glaister and colleagues compared this formula with other approaches in their multiple-sprint measurement study.
The calculation describes the pattern inside that test. It does not identify why the later efforts slowed, and it does not diagnose an athlete's conditioning from one session.
Why the formula deserves a footnote
Glaister and colleagues compared eight ways to quantify fatigue in multiple-sprint running. Ten physically active men completed two protocols of 12 × 30 m sprints, with efforts scheduled every 35 or 65 seconds. Times were measured with twin-beam photocells. Their analysis supported percentage decrement as the most valid and reliable of the methods they examined, while the test-retest variation across formulas was wide. The 2008 paper is a reason to name the formula in a report rather than write only “fatigue score.”
A systematic review of repeated-sprint ability tests reached a more cautious view of fatigue indexes. It found high test-retest reliability for measures such as total work and best sprint performance, but weak absolute and relative reliability for the fatigue index. The review also found that study protocols differed in sprint mode, repetition count and recovery. Lopes-Silva and colleagues recommended keeping total sprint time, total work and best performance among the main variables.
An index can change when the first sprint changes, even if later times stay similar. Keep the raw repetition times beside the summary.
Read the set as a small profile
A coach looking at this set can see three things: the fastest effort, the total time and the percentage decrement. Those values answer related questions, but they are not substitutes for one another. The best time describes the fastest effort. Total time describes all six efforts together. The decrement compares the total against a mathematical reference.
Two athletes can have the same calculated decrement while showing different repetition patterns. One might run each effort close to the previous one. Another might post a faster opening sprint followed by a larger fade. The summary hides that difference. A line-by-line time series or split table shows it.
| Report field | What it says | What it cannot establish alone |
|---|---|---|
| Best sprint | Fastest time in this test | How well the athlete repeated it |
| Total sprint time | Combined time across all repetitions | Which repetition changed the total |
| Percentage decrement | Total relative to repeated best-time efforts | The physiological cause of any slowing |
| Every repetition | The shape and order of the efforts | Whether a different protocol would show the same pattern |
Hold the protocol constant
Write down sprint distance, repetition count, recovery duration, recovery activity and start instruction. Record the surface and whether each effort used one lane or multiple lanes. A 6 × 30 m set with 30 seconds of passive rest does not equal a 12 × 30 m set with 65 seconds between starts, even if the report uses the same fatigue formula.
Familiarization matters too. Glaister and colleagues separately studied familiarization and reliability in repeated sprint running. Their paper is a reminder to decide whether the first exposure is practice or a scored baseline, then use the same rule on later test dates. The 2007 study examined its own protocol, so apply the finding to the design question rather than assuming an identical learning effect in every group.
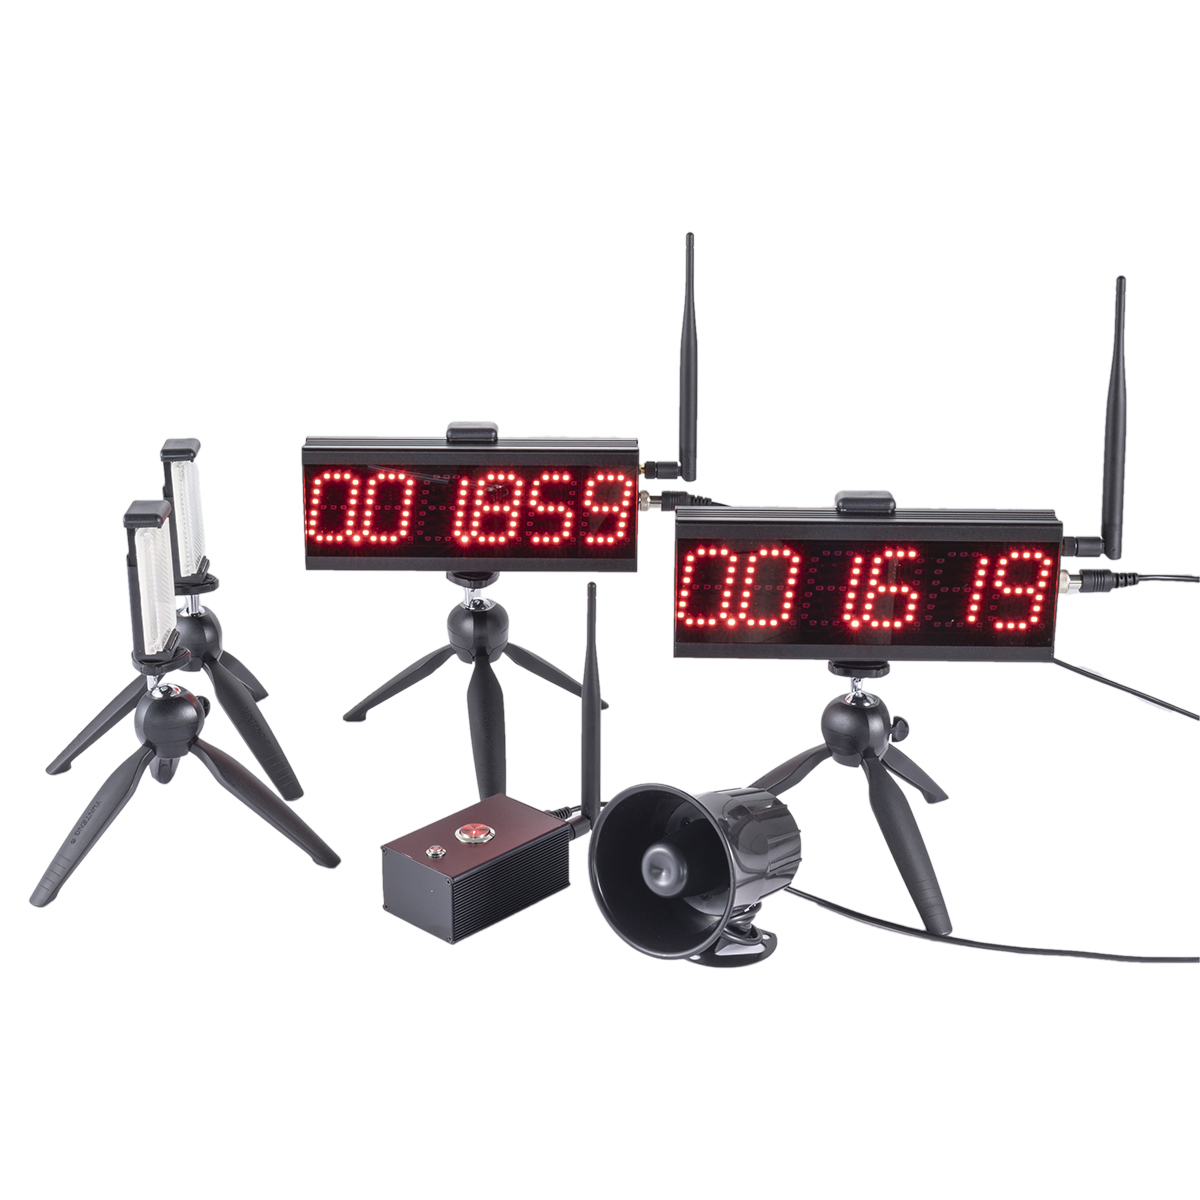
For team sessions, an electronic system can preserve the time of each crossing, but the operator still has to define how the first start and each repeat are triggered. The S-003 product page lists two-lane timing and multi-lap support by mode. Check the exact package and mode for the planned protocol; do not infer that the device calculates an exercise-science fatigue score.
The repeated sprint test setup guide covers the test lane and event sequence. The CSV export guide explains how to keep athlete IDs and event fields attached to the raw times. Those records are more useful than a single percentage if a later review asks where the result came from.
Choose one primary outcome before testing
If the session is designed to compare total repeated-sprint performance, state that total time is the primary measure. Keep best sprint and decrement as secondary context if they help answer a separate coaching question. If the coach cares about the pattern across efforts, retain each time and review the sequence.
That approach avoids turning a formula into a verdict. The study literature supports some summaries more consistently than others, and each number remains tied to its test design.
Repeated sprint score questions
Does the formula use the best or first sprint?
The percentage-decrement formula shown here uses the best sprint as the ideal reference. Other fatigue formulas may use different comparisons, so cite the exact equation.
Is 3.6% good or bad?
The example is arithmetic, not a norm. The research protocols and participant groups vary, and the number needs context from the same test and population.
Should the first sprint be excluded?
Follow the protocol you selected. Changing which repetitions count changes both total time and the reference calculation.
Research and product sources
- Glaister, Howatson, Pattison and McInnes (2008), The Reliability and Validity of Fatigue Measures During Multiple-Sprint Work: An Issue Revisited, Journal of Strength and Conditioning Research.
- Lopes-Silva, Santos, Abbiss and Franchini (2019), Measurement Properties and Feasibility of Repeated Sprint Ability Test: A Systematic Review, Strength & Conditioning Journal.
- Glaister et al. (2007), Familiarization and Reliability of Multiple Sprint Running Performance Indices, Journal of Strength and Conditioning Research.
- 01TIMER, S-003 dual-track system details.